

Dashboard and live data
Dashboard
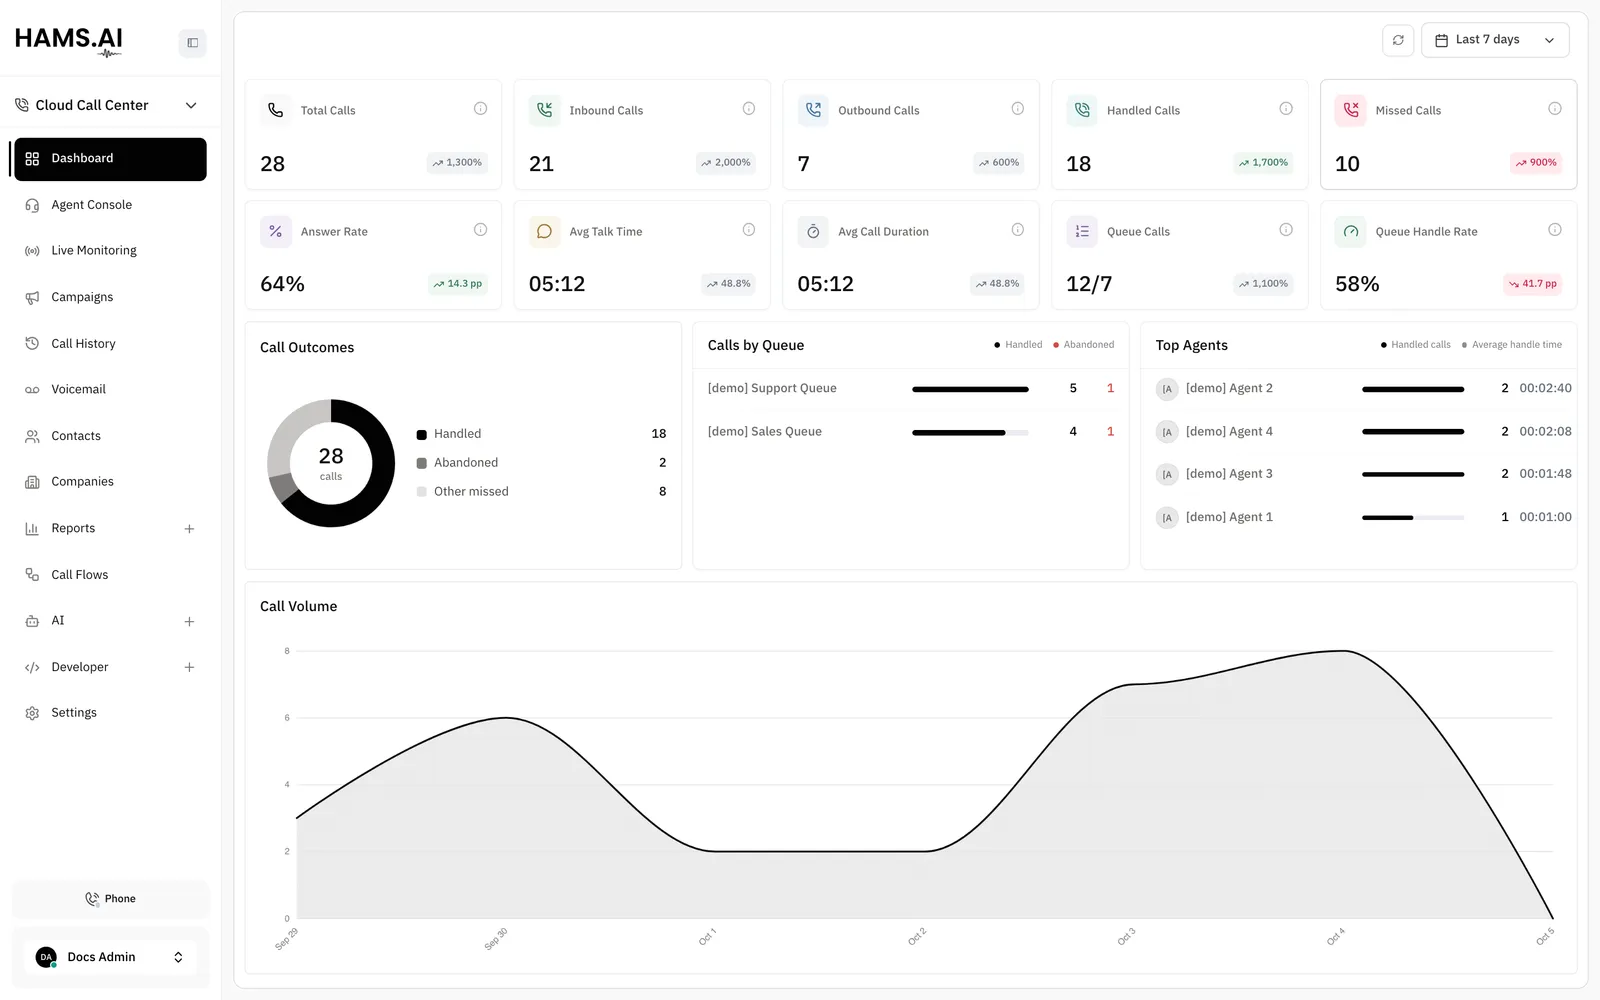
The Dashboard page opens at /app/accounts/{account_id}/call-center. Administrators and agents can open it. An administrator sees the calls of the whole account. An agent sees only their own calls.
The dashboard counts inbound and outbound calls. It does not count calls between 2 extensions.
Set the period
Click the date range button at the top of the page. Choose Today, Last 7 days, or Last 30 days. You can also pick a custom range in the calendar. The default is Last 7 days, which includes today.
A custom range can cover up to 366 calendar days. Click the refresh button to load the figures again.
Each card shows the change from the previous period of equal length. A count changes in percent. A rate changes in percentage points, shown as pp.
The system keeps the figures for a short time before it computes them again. Two people who open the dashboard in the same short window see the same figures. The newest calls can be absent until the next refresh.
Metric cards
Charts
The Call Volume chart groups calls by hour for a period of 1 day. It groups them by day for up to 31 days. It groups them by week for up to 92 days. For a longer period, it groups them by month.
Live data
The Live Monitoring page opens at /app/accounts/{account_id}/call-center/live-data. Only administrators can open it. The page updates when a call, a queue, or an agent changes. You do not need to reload it.
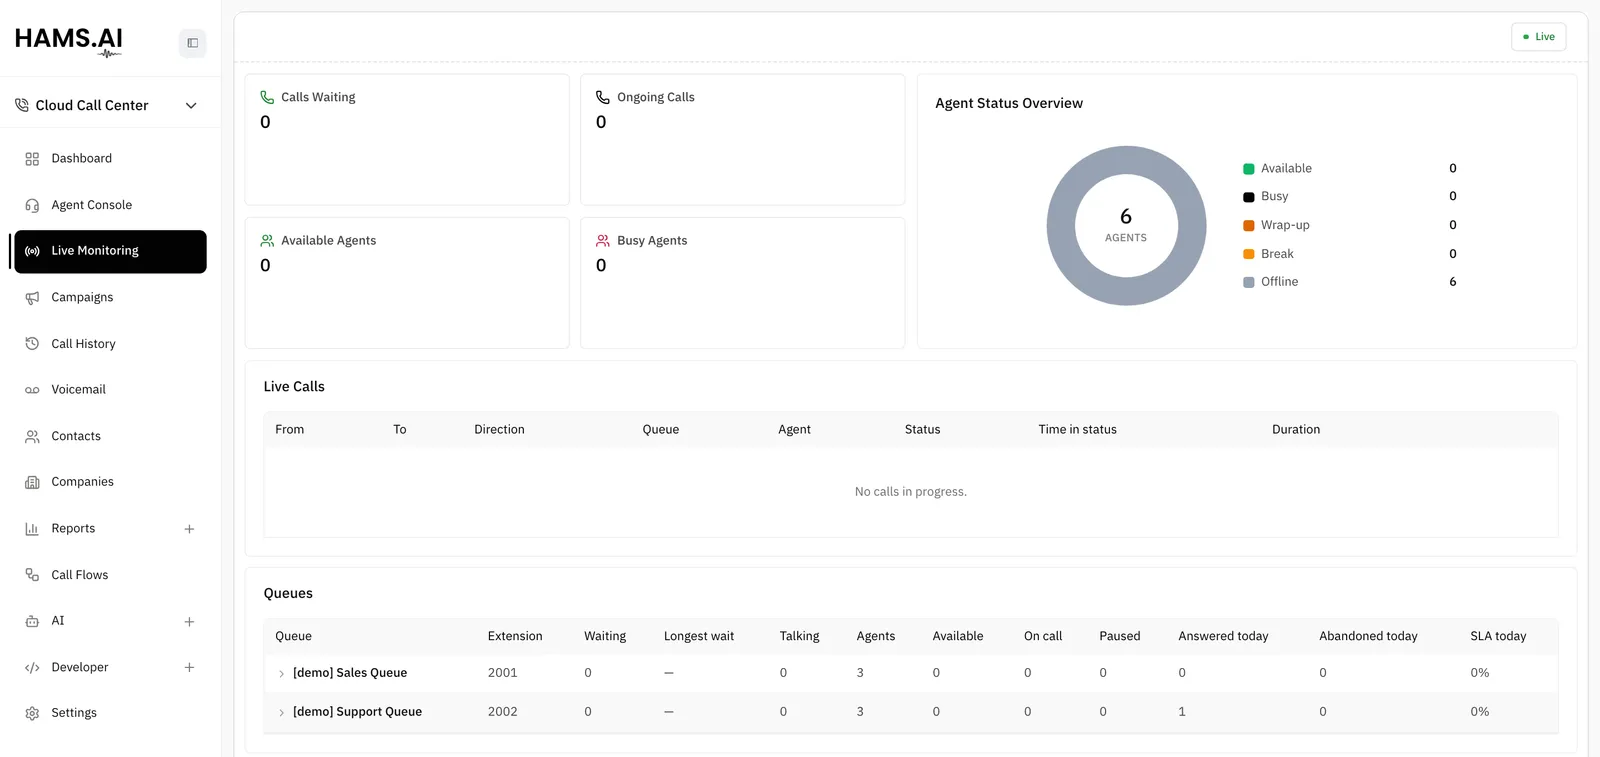
A chip at the top right shows the state of the connection: Live, Connecting…, Reconnecting…, Not connected, or Blocked. When the connection is down, the tables become dim because their figures can be old.
If the page shows Live data is not available, click Retry. If the page shows Live data is blocked, the call center service refused the address of the dashboard. Ask Hams support to let the dashboard connect to the service.
The 4 counters show the totals now:
- Calls Waiting counts the callers in all queues.
- Ongoing Calls counts the calls that have not ended.
- Available Agents counts the agents who can take a call.
- Busy Agents counts the agents who cannot take a call. The count includes agents in wrap-up.
The Agent Status Overview chart splits all agents into Available, Busy, Wrap-up, Break, and Offline.
Live Calls
The Live Calls table lists every call in progress. The columns are From, To, Direction, Queue, Agent, Status, Time in status, and Duration.
The Status column follows the call from step to step:
Some calls have no step. For these calls, the status shows the state of the call: Connecting, Ringing, or In progress.
Time in status is the time that the call spent in the current step. Duration is the time since the call started. An ended call stays in the table for a few seconds. Its status shows how it ended: Answered, No answer, Busy, Failed, Abandoned, or Ended.
For an outbound call, the Agent column shows the extension that placed the call. This is true when an agent dialed the call on their phone. It is also true when the system placed the call through the API.
Live transcript
Hams support turns on the live transcript for your account. It is a pilot feature. Only administrators can see it, because only administrators can open the live board.
Click a row in the Live Calls table to open the Live transcript panel for that call. Click the same row again to close it. You can also click Close transcript or press Esc.
The panel header shows the number of the caller and the agent, for example 0501234567 → Sara. Lines of the caller are on one side, and lines of the agent are on the other side. The panel names the speaker (Caller or Agent) when the speaker changes. A line in italics is not final. The words can change until the line is final.
The transcript starts when the caller and the agent talk. The panel shows Waiting for the call to connect. until the call connects. Then it shows Waiting for the first words. The first words appear a moment after someone speaks them. Each line is in the language that the speaker used.
A row in Live Calls shows an audio icon next to the status when the call has a transcript. Point at the icon to see Transcript available.
These rules apply:
- The transcript covers a call between a caller and an agent.
- Hams limits the number of calls that it transcribes at the same time. A call that Hams does not transcribe has no icon, and its panel stays empty.
- Transcription of one call stops after 15 minutes.
- The panel follows the newest line. If you scroll up to read an older line, the panel stays where you are.
- Drag the header to move the panel. Drag the lower corner to change its size. The browser remembers the position and the size.
- When the call leaves the table, the panel closes and the transcript goes. The live board does not keep it.
Queues
The Queues table has one row for each queue. The columns are Queue, Extension, Waiting, Longest wait, Talking, Agents, Available, On call, Paused, Answered today, Abandoned today, and SLA today.
SLA today uses the same rules as the queue reports. Point at the value to see the target, for example Answered within 20s. See Reports.
Click a row to open a queue. The Waiting list shows the callers who hold. The Members list shows the agents of the queue, with their status. The label Paused marks an agent who takes no calls from this queue.
Agent Status
The Agent Status table lists every agent who has an extension. The columns are Agent, Extension, Status, For, Queue, and Note.
The For column shows how long the agent is in the current status. The time counts up. In Wrap-up, the time counts down to the end of the wrap-up time. The Queue column shows the queue that the agent works for while the agent rings, talks, or wraps up. The Note column shows the text of a custom status.
If the phone of an agent has no registration, the table shows Offline immediately. This is true for any status that the agent chose.
Use the tabs All, Available, Busy, Break, and Offline to filter the table. The Busy tab has the agents in Ringing, On call, and Wrap-up. The Break tab has the agents in On break.
Supervisor actions
An administrator can act on the calls and the agents that the board shows. The system records the name of the administrator and the time of each action. It records the action before it runs the action.
The administrator can do these actions:
Listen, whisper, and barge in always join the agent side of the call. Click one of the icons. Your extension rings. Answer the call on your phone. You are now on the call.
After you join, you can change the mode with the keys of your phone. Press 4 for listen. Press 5 for whisper. Press 6 for barge in. Your phone shows the call as spy with the name of the agent.
Click Hang up. A dialog asks End this call? Click End call to confirm.
These rules apply:
- You need an active extension of your own. If you have none, the system refuses the action and says so.
- The icons for listen, whisper, and barge in work only when the call has the status Talking or On hold. A call in the IVR or in the queue has no agent to join.
- You can monitor one call at a time.
- The system limits the number of actions for each administrator in each minute. If you pass the limit, the system refuses the action and does not record it.
- The pause of an agent is live state. The system does not store it. A restart of the call server removes it.
Get the legal advice for your country before you listen to a live call. In many countries, a supervisor who listens to a call needs notice, consent, or both. The platform records who listened to which call. It does not play an announcement and it does not enforce a policy.